
Changes Over Land Using Satellite Imagery Comparison Tool.
Our Solutions
The Overview
Introduction
Satellite image based spectral analysis of two or more time period data has been conducted for different projects to undermine the changes and potentially changing areas especially with respect to increase in built-up area , Striking changes can be observed for urbanization, deforestation and land diversion .Using high resolution satellite images we are able to quantify the increasing or decreasing trends in terms of area and volume.
SOLUTIONS
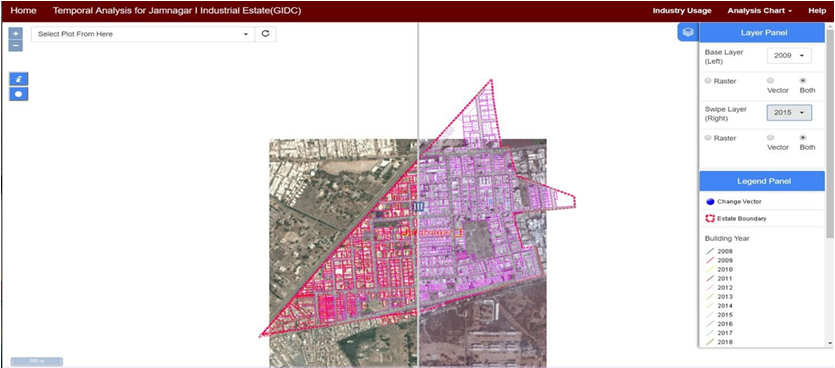
For this Web-GIS application, through temporal analysis application, we have identified & tracked changes from the satellite images year wise, starting from the year 2008 to the year 2016, so that we can identify changes over the years & visualize spatial-temporal data.
Through ‘Swipetool’ we can simultaneously compare data of two different years in the Web browser.
We did Stitching, Mosaicking and removing inherent errors in the process, to provide relatively high accuracy on the ground on a yearly basis from 2008 to 2016
Using the analysis chart we have shown some relevant graphs such as ‘Industry Usage classification ’ map in which a smart visualization of Industries & its graph is shown. These various graphs are shown on web browsers subject to data availability from GIDC.
Conducting radiometric enhancement and geometric corrections on the temporal satellite images procured for better interpretation for all 50 GIDC estates subject to availability of already georeferenced data from GIDC.
The acquired satellite images were georeferenced based on received Draft Development plans from Customer.
Digitized industrial/building footprints, roads and also identifying new industrial area’s / building that has come up since 2008 till 2016 considering
Finally, we developed a lightweight WebEnabled GIS Application for identifying changes in the area on a year to year basis
RESULTS
Developed an Open Source GIS Based Web Application that helped a increase revenue of 20 %